Recompete Radar

Federal contracting, explained with data.

Which contracts are ending, which companies hold them, and what deserves a closer look? I built Recompete Radar to make those questions easier to explore. Federal contracting is the subject matter. The work is the transferable part.

Scope today: 484,242 prime contract awards at 20 civilian agencies, FY2008 onward. No DoD. My work: data collection, cleaning and testing, analysis, and everything below.

Questions the data answers

Each one starts with a question a contractor or an agency would ask, and answers it with charts you can explore.

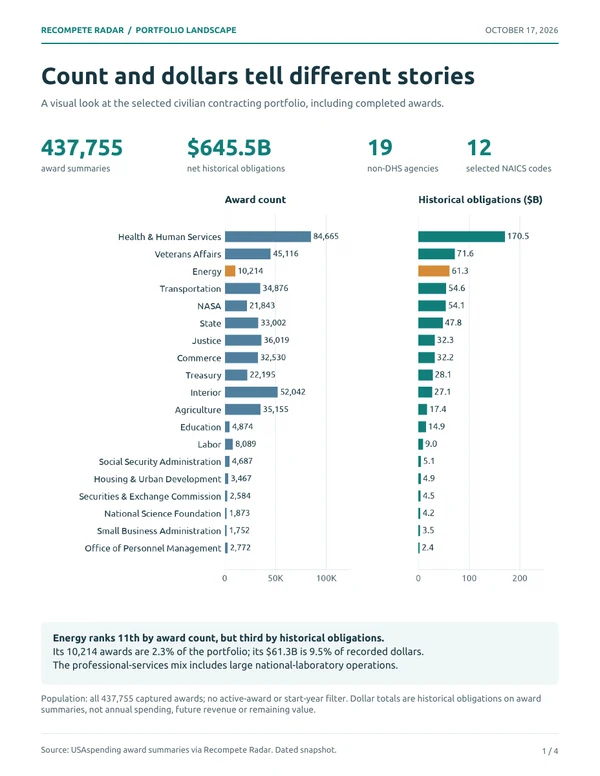
First page of the portfolio landscape report, with paired charts comparing award counts and historical obligations by agency.

How do the agencies compare? · 4-page PDF

Civilian contracting in perspective

Which agencies award the most contracts, and which spend the most? Award counts and historical dollars sit side by side, followed by the industry mix, how concentrated each market is, how much is competed, and when contracts end.

Snapshot: · 19 civilian agencies, excluding DHS. Includes completed awards.

Four traps in public contract data

445,864 option dates vanished without an error. Subcontract re-filings doubled the dollar total ($107.8B against $50.7B). Bid counts turned out to be placeholders. My first score tied 54% of candidate contracts at its maximum. See how I caught each one, tested a fix, and wrote down what the data can and cannot support.

How it's built

From a public download to a web app, with tests at each step.

  1. 01 USAspending Public award downloads, one per agency
  2. 02 Python Ingestion with retry and backoff
  3. 03 Snowflake Stage, then COPY INTO. Raw files stay unchanged
  4. 04 dbt Staging, a score backtest, then tested marts
  5. 05 Neon Postgres Only the tables the app reads are synced
  6. 06 FastAPI Read-only API over the marts
  7. 07 Next.js on Vercel The web app people use

Airflow DAGs are built and tested for the weekly refresh, nightly SAM.gov notice loads and daily freshness checks, alongside a GitHub Actions refresh workflow.

The score was rebuilt after it failed a test

My first score added up hand-set points. When I tested it, 54% of candidate contracts were tied at its maximum, and it scored 0.56 at predicting whether the incumbent kept the work (0.5 is a coin flip).

I replaced it with two transparent logistic scorecards, fitted on awards that ended before 2021 and tested on later ones, 94K ended awards in all. Retention now scores 0.84 and follow-on 0.62. A placebo check on the retention model still reaches 0.80, so much of that signal comes from how follow-on awards are matched. The scores are a ranking for deciding what to research first. They are not win probabilities.

It grew in three steps

  • FirstOne agency (DHS) on Postgres.
  • ThenSix agencies, same Postgres setup.
  • NowSnowflake and dbt. 20 civilian agencies and 12 service categories, FY2008 onward: 484,242 prime contract awards.

What testing the data turned up

  • A date format quietly erased every option end date. The fix restored 445,864 of them.
  • Subcontract reports double-count. Adding every report gives $107.8B. Keeping the latest valid report per subcontract gives $50.7B.
  • Two orders can share a contract number, so identity is checked on the ID and its parent ID together.
  • 7,943 contract descriptions turned out to be accounting tags and nothing else.

A project I designed and built myself, not production work for an employer.

The live app

Filter contracts nearing their end dates by agency or vendor and see what contributes to each ranking. The first load can take a few seconds.

Up next

Federal grants are the next data source I plan to look at. Nothing is built yet.

Open to full-time roles · NOVA/DMV
Recompete Radar shows how Peter works: take a large, messy public dataset, test it, find the question worth asking, and answer it clearly.
View resume Contact Peter
Opening live demo. Some hosted apps need a few seconds to wake up.